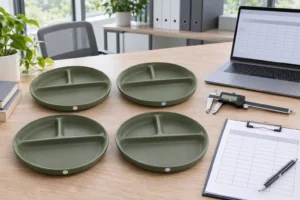
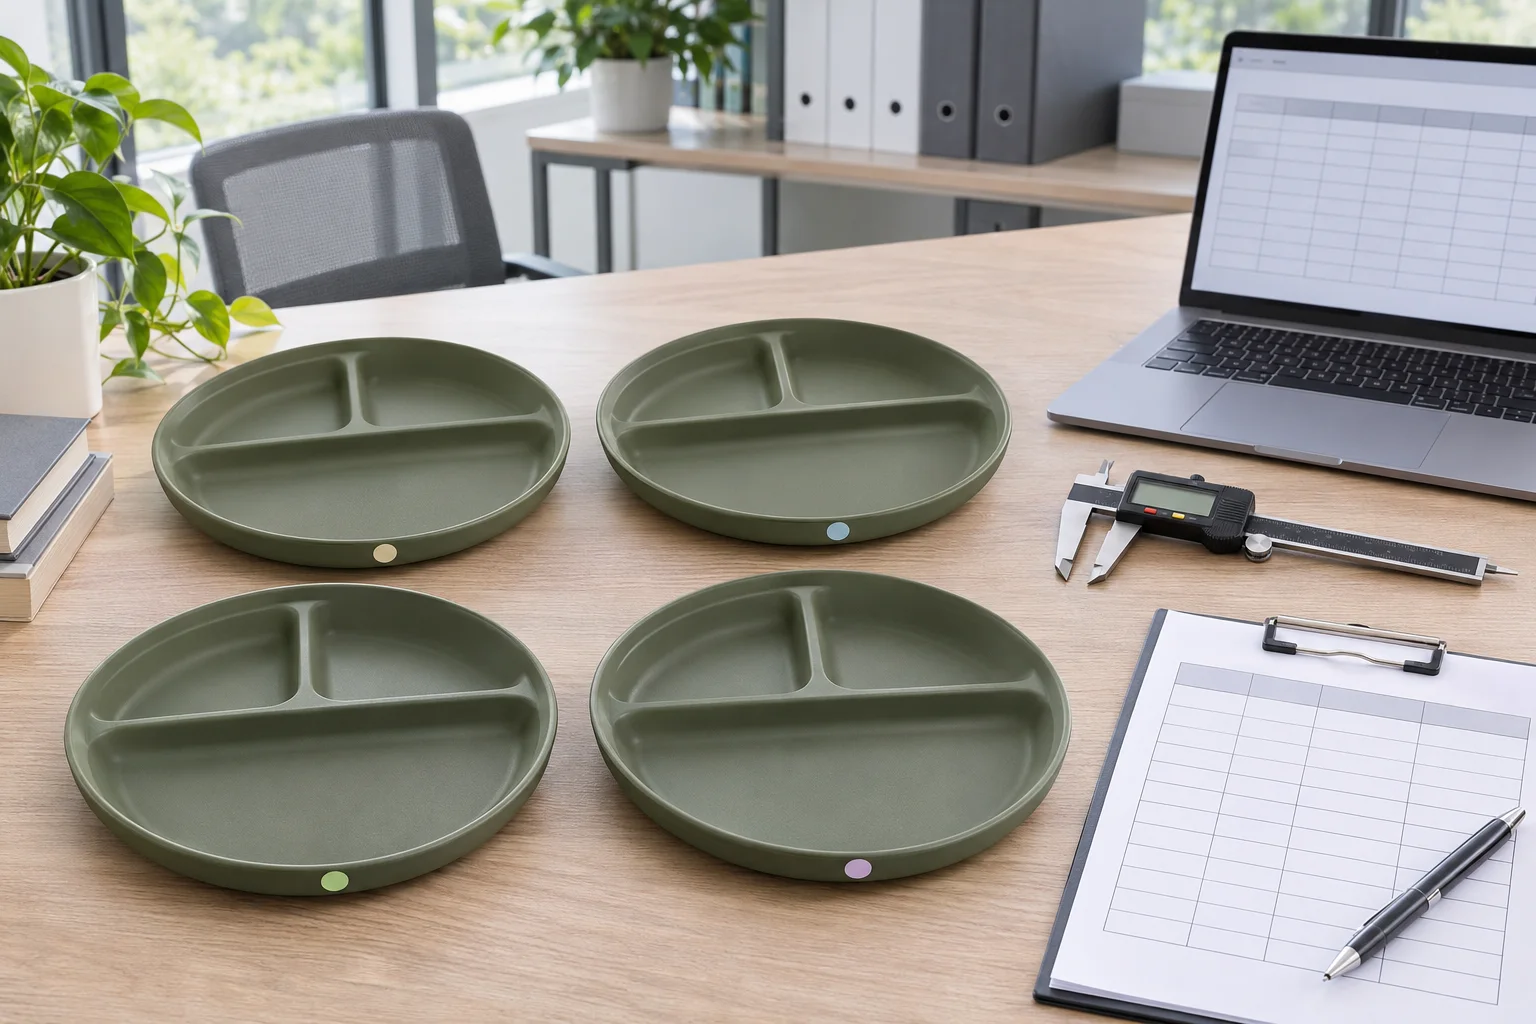
Molded tableware cavity variation must be checked by keeping cavity identity attached to every repeated component and by measuring the same feature with the same approved method. A pooled average can hide one shifted cavity. Buyers need a balanced cavity-by-time sample, raw readings and a decision rule that separates cavity effects from measurement error and production drift.
Direct answer: sample every active cavity at the same defined production intervals, retain the cavity mark for each component, and measure identical drawing features with one approved method. Compare each cavity’s raw values, mean, range and specification margin; also check time order. Do not approve from pooled averages when one cavity can be masked by the others.
What Must Buyers Separate Before Comparing Mold Cavities?
A cavity result is meaningful only when the component is traceable to an active cavity and other changing conditions are visible. Record tool or mold ID, cavity ID, component code, drawing revision, production time or sequence, material/color batch, machine or line when relevant, and the measurement-system revision.
Cavity effect
A consistent difference tied to one cavity across repeated intervals. It may appear as a shifted average, wider spread or recurring near-limit result.
Time or process effect
A change affecting several cavities together as conditions move over the run. Time-ordered rows are needed to see it.
Measurement effect
Variation introduced by tool resolution, fixture, contact force, datum access, operator or environment. Review this before blaming the mold.
NIST notes that observed process variation accumulates from multiple sources and that process characterization should identify and quantify them. Its guidance on process variability, propagating error and measurement-process variability supports separating sources rather than assigning every difference to the cavity.
How Should a Cavity-to-Cavity Sampling Plan Be Balanced?
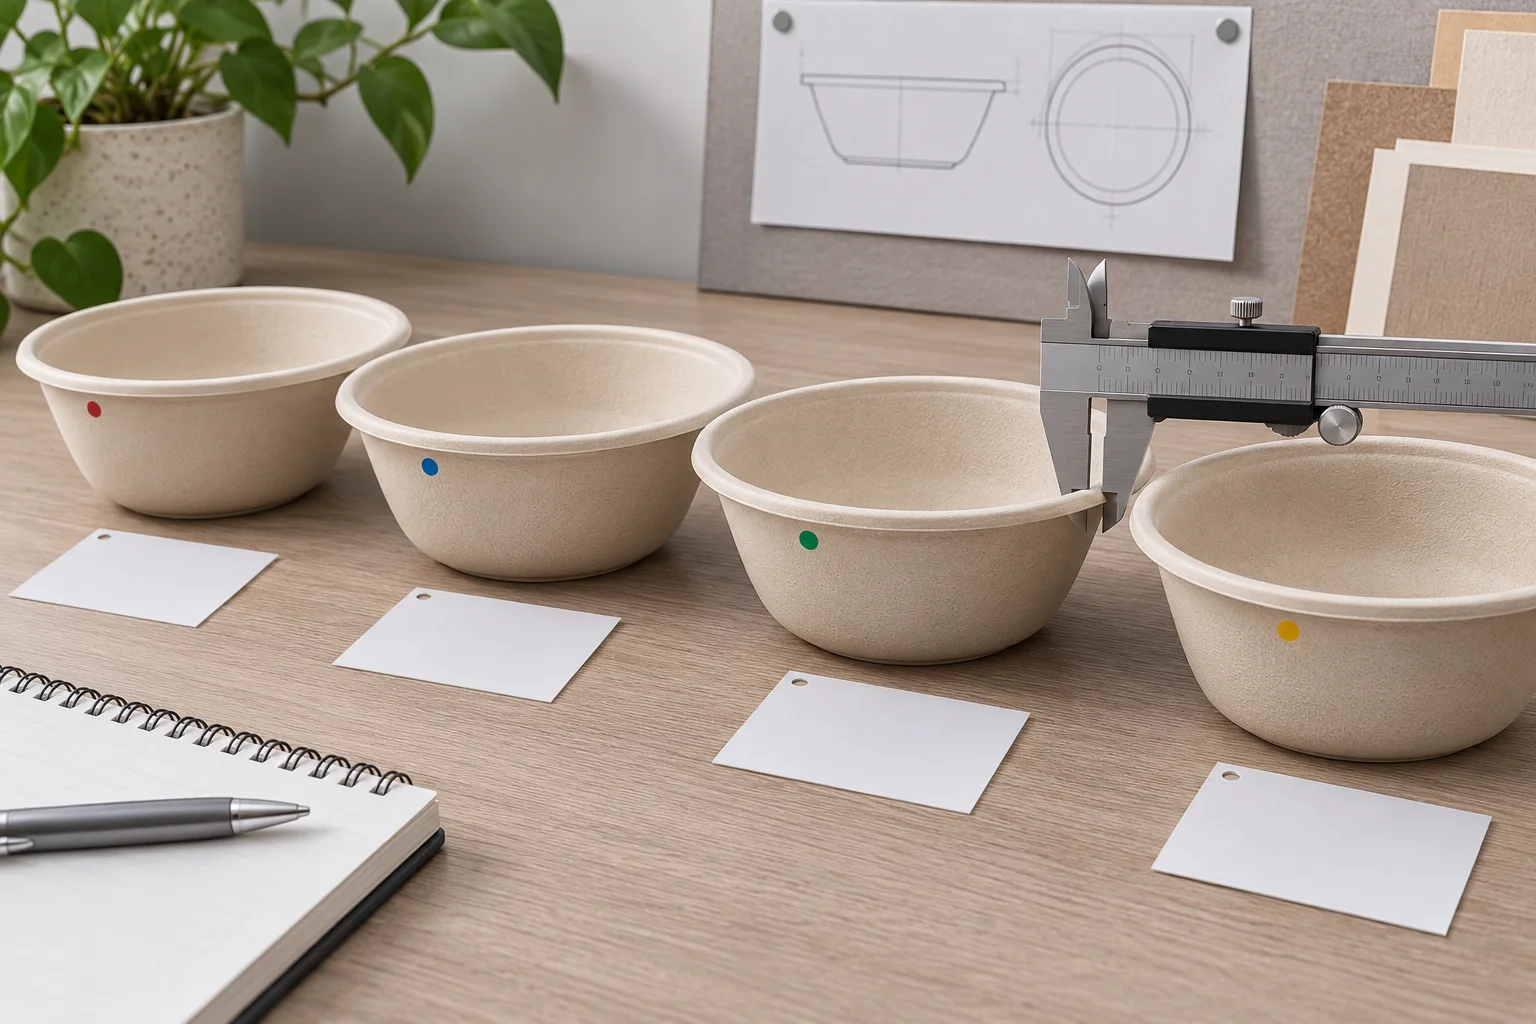
Use the same planned count from every active cavity at each selected interval. Do not take many parts from an easy-to-reach cavity and only one from the rest. The exact sample count and intervals are risk-based project decisions; this guide does not invent a universal number.
| Plan field | Buyer instruction | Why it matters |
|---|---|---|
| Active cavity list | Record all enabled cavity IDs and any blocked cavity | Prevents an unrepresented cavity from entering approval |
| Intervals | Define start, middle, end or other time/sequence points | Separates repeated cavity behavior from run drift |
| Balanced count | Use the same project-approved count per cavity per interval | Prevents weighting one cavity more heavily |
| Random selection | Choose components without selecting only visually favorable pieces | Reduces selection bias |
| Sample identity | Mark cavity, interval, component and sequence before mixing | Preserves the evidence chain |
| Measurement order | Randomize or alternate cavity order when appropriate | Reduces confounding with operator or instrument drift |
| Repeated readings | Use the approved repeatability plan on defined samples | Shows whether measurement noise is material |
Start from the approved measurement-system review. Use the camping-set CTQ tree to select characteristics, and preserve the released drawing and method from the first article inspection.
Use This Cavity-to-Cavity Sampling and Comparison Table
Copy one row per characteristic, cavity and interval. Keep raw readings in the linked record rather than retaining only averages.
| Field | Required entry | Comparison output | Action if missing |
|---|---|---|---|
| Component / revision / feature | Code, drawing revision, characteristic, datum and units | One controlled measurement target | Hold comparison |
| Mold and cavity identity | Tool ID, cavity ID and active/blocked status | Traceable cavity group | Do not pool unidentified parts |
| Run interval | Date/time or sequence point and process-lot reference | Time-ordered subgroup | Cannot distinguish drift |
| Specification | Lower and upper limits from released drawing | Tolerance width and margin | Resolve requirement conflict |
| Measurement method | Tool ID, method revision, fixture, operator and conditions | Comparable measurement basis | Review method first |
| Raw readings | Every result with sample identity | Visible distribution and outliers | No approval from summary only |
| Cavity mean | Sum of cavity readings ÷ count | Location comparison | Keep calculation open |
| Cavity range | Maximum − minimum for the defined subgroup | Within-cavity spread | Investigate missing values |
| Specification margin | Nearest limit minus the relevant observed value | Near-limit visibility | Apply decision rule |
| Time pattern | Plot or list values in production order | Stable, drifting or intermittent pattern | Add interval evidence |
| Decision and authority | Approve, hold, investigate or conditionally release | Owner, date, conditions and next trigger | Remain open |
How Should Buyers Calculate and Read the Comparison?
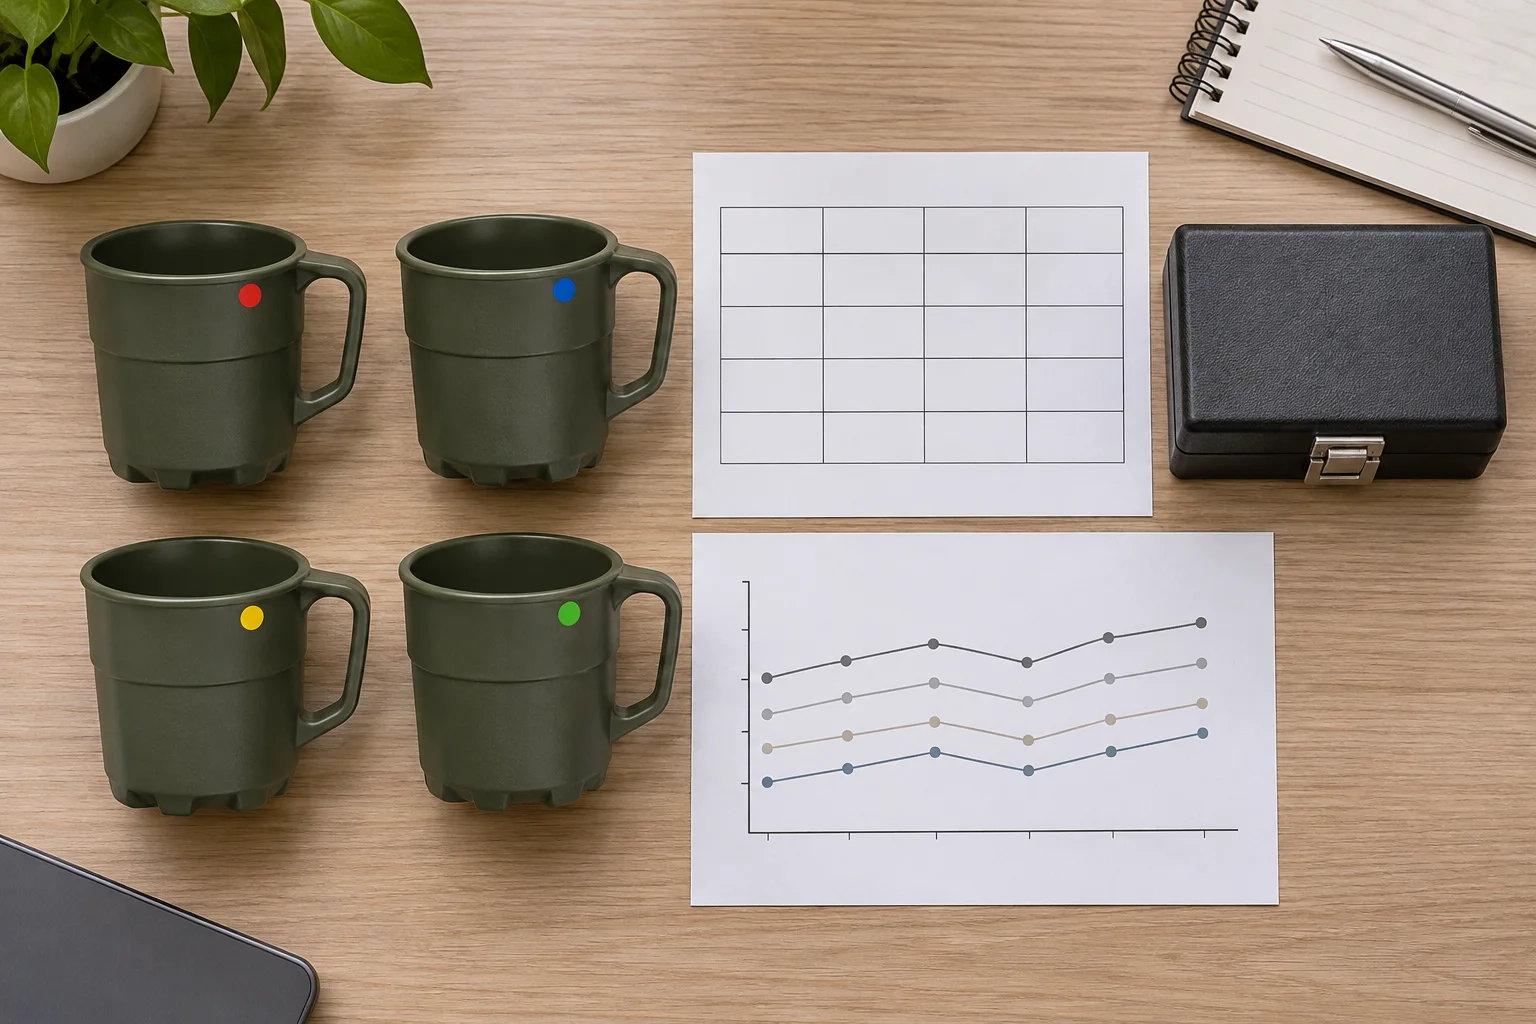
For each cavity and interval, calculate the mean and range from the raw readings. Then compare cavity means, cavity ranges and distance to each specification limit. A pooled mean is only an overall summary; it cannot show whether one cavity is consistently higher or lower.
Illustrative calculation only: if four readings from one identified cavity are 99.8, 100.0, 100.1 and 100.1 in the drawing unit, the mean is 100.0 and the range is 0.3. These values do not imply an acceptable tableware specification. Replace them with project data and apply the buyer-approved decision rule.
Do not confuse a difference with a proven cause. A cavity pattern can justify investigation, but mold correction, process adjustment, sorting or release should be based on controlled evidence. Where measurement error is material, improve the method or quantify it before concluding that the cavities differ.
What Decisions Follow a Cavity Variation Review?
All represented cavities meet the released limits and the buyer’s comparison and decision rules with an adequate measurement method.
One cavity is shifted, unusually variable, near a limit, unidentified or confounded with time or measurement effects.
Only when a documented, authorized condition defines scope, risk, segregation, evidence, owner and closure trigger.
Do not silently remove an unfavorable cavity from the report. Record blocked-cavity status, segregation controls and the revision that authorizes any change. Link accepted results to the pre-shipment release sheet only after the production inspection method is confirmed.
What Evidence Must Buyer and Project Team Exchange?
Released limits, critical features, cavity-comparison rule, sampling rationale, decision rule and deviation authority.
Active-cavity map, time-ordered sample IDs, raw readings, method/tool records, process-lot links and exceptions.
Cavity statistics, patterns, open issues, decision, owner, conditions, revision, date and re-review trigger.
Buyer Questions About Mold-Cavity Variation
Can the supplier combine all cavities into one average?
Not for cavity comparison. Keep cavity-level results visible. The combined average may be reported as a secondary summary only.
Does one sample from each cavity prove stability?
No. One value cannot show within-cavity spread or time behavior. Define a balanced, risk-based sample across selected intervals.
Should every molded dimension be compared?
Prioritize released critical and fit-related characteristics. Measuring unimportant features can consume effort without reducing procurement risk.
Can visual inspection replace dimensional comparison?
No. Visual criteria can be a separate requirement, but they do not substitute for a defined dimensional or functional characteristic.
Does this table prove Naike production capability?
No. It is a buyer decision tool. Capability, exact mold design, cavity count, process conditions and results remain project-specific evidence.
Request a Molded Tableware Cavity Variation Review
Send the component drawing, active-cavity map, critical features, proposed sample intervals, measurement method and release rule. Naike Dinner can organize the project evidence into a cavity-to-cavity sampling and comparison table before sampling, quotation or production approval.
Send the cavity sampling briefRequest comparison reviewPrepare a B2B quality inquiry
Updated . Evidence scope: buyer decision support. Nothing in this guide verifies a specific product, mold, cavity count, lot, capability, inspection result, MOQ, price, capacity, lead time or performance claim.